GPU Computation and Rendering
Imag(in)ing reality, with lasers
Touch and drag on the visualization below to interact. On a mobile device, tilt to look up and down. Click left and right arrows to transition between scenes
These scenes began as hundreds of millions of points – 3-D pixels – captured by a LiDAR scanner – a specialized camera using lasers to see depth as well as color. As founder of AiR VR Studio, we developed a framework for the Unity3D game engine to render, edit, and interact with these point clouds in VR.
Based on that code, I wrote this lightweight Javascript/WebGL engine to share point clouds on the web, to give you a glimpse of what walking through a point cloud in VR might feel like – without having to give you a VR headset.
The power of this engine is the interactivity it supports between user and point world. A custom physics engine is running on every point, and it even supports smartphones. We reworked the engine computations to fit within the constraints of iOS and Android WebGL platforms. Since WebGL doesn't support compute shaders, the rasterizer pipeline has to be hacked and slightly abused to run the physics computations as well as render the point data. More importantly, the state vectors have to be encoded across multiple image buffers.
In the VR version, the audience flies through these world. You touch pixels with your hands, changing their shape and size – painting, bending, and twisting the virtual world around you.
Interactive Touch-less Displays
For large LED displays and projection, we developed an interactivity module, drawing input from a Kinect depth sensor to allow users to “touch” the 3-D world within the display without actually touching the screen.
The video below shows individuals interacting with these displays for the first time. There are two visuals pictured:
- 1) A live generated 3-D model of the sound and voices in the room. This is explained in the next section.
- 2) A high resolution rendering of the Redwoods point cloud, seen above.
Both of these visuals are created using the AiRStudio Unity3D plugin I developed:
Sound Visualization | AiR Listen
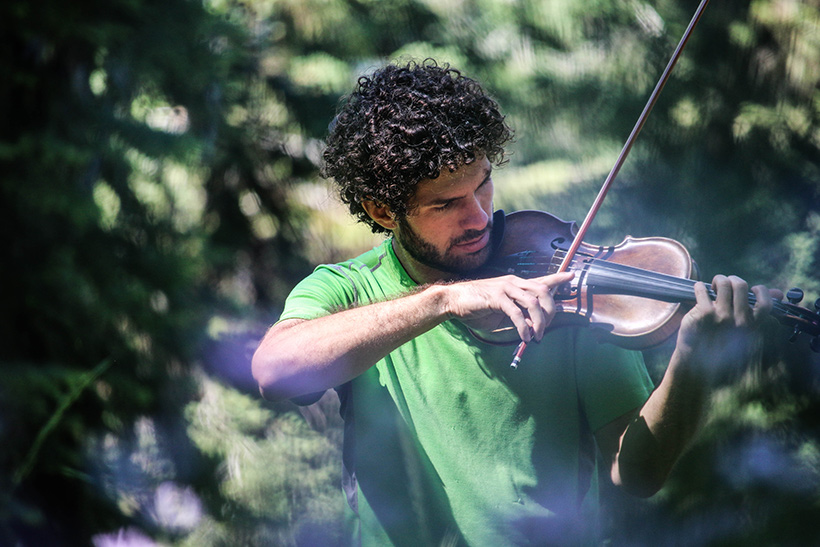
Developed first as a composition tool (I wanted to see a violin’s overtone series in relationship to the chords and melodies of a song), we later released AiR Listen to the iOS App Store based on interest from others. Most frequency-domain graphs lay out amplitudes of the audio spectrum along a straight line. But our brains don't comprehend sound in that way. This novel helical visualization maps more naturally onto our own experience of sound. It portrays note relationships across octaves.


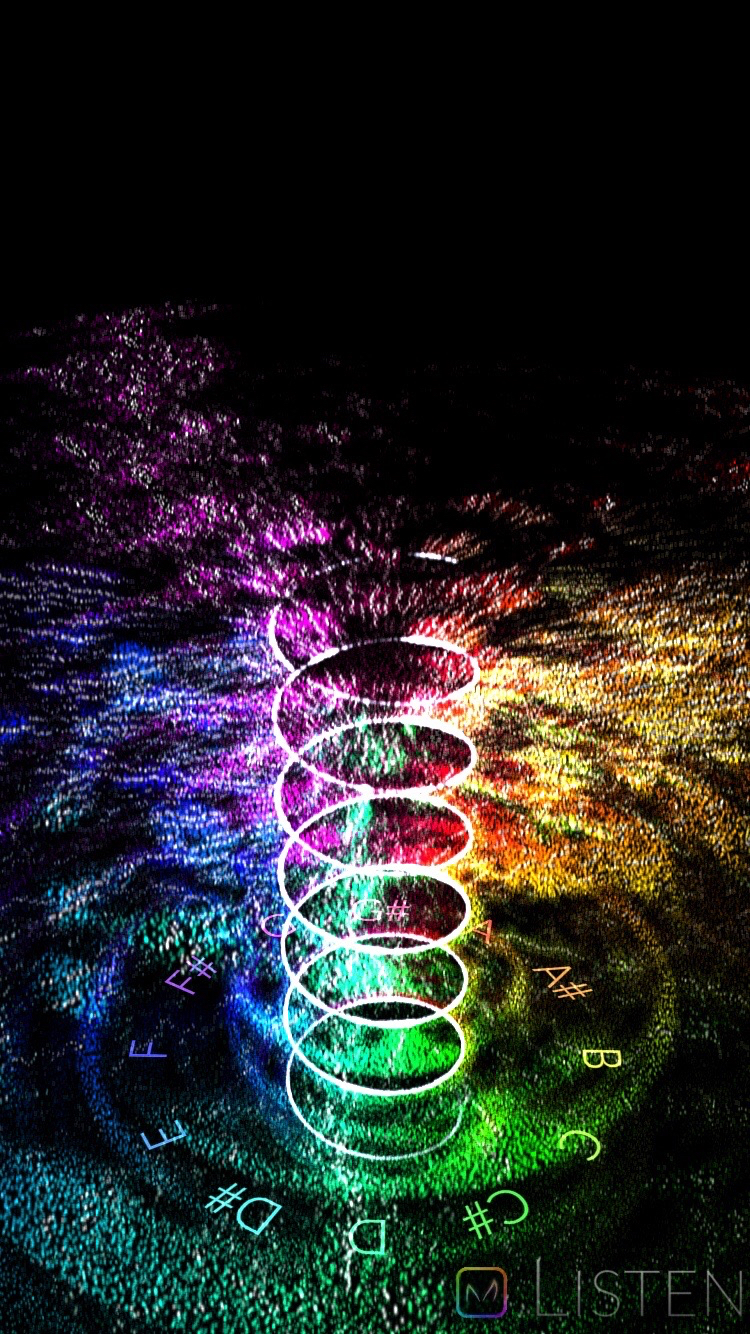

In AiR Listen, each octave is represented by one loop of the helix, and as a result, the tone spectrum is visually organized by note letter: A, B, C, D, E, F, G (plus semitones). All tones within the same note letter (or "pitch class") become vertically stacked.
For example, if you look straight down on the helix (seeing a circle) while multiple octaves of the note "A" are being played, those A's will all visually line up with each other, appearing as one. When you look at the helical model from the side however, the octave of each tone is revealed. This visualization works well on a phone, but it becomes even more intuitive viewed in 3-dimensional space via virtual reality headset or hologram.
With time, each of the glowing particles created by tones drift outward. As the app listens to the sounds around you, it generates a 3-D record of what you are hearing and have heard. The circular and spiral correlation with a traditional music record is only a coincidence, as the two 'records' are of very different format, but the similarity is fascinating nonetheless.
Video screen capture of app while listening to music:
From a technical perspective, AiR Listen leverages the same high performance GPU point engine developed for the LiDAR pointcloud rendering above, but it uses an entirely different data structure and behavior set. This is part of the power of the AiRStudio framework – it offers the ability to extend the base point system for widely different applications, while maintaining high performance optimization.
“The most profound technologies are those that disappear. They weave themselves into the fabric of everyday life until they are indistinguishable from it.”
Through technology, music, and film, we share glimpses of our world from perspectives that we couldn't reach before.
My motivation to document and better understand the natural world is captured in the quote above: the biological mechanisms which keep us alive have developed over a 3.8 billion year evolution. They are woven into the fabric of everything about and around us, but they are invisible to the naked eye.